The Meta Ads Breakdown Effect Explained
Meta Ads
July 6, 2026

Table Of Contents
You pulled up Ads Manager, broke performance down by placement, and saw stories running at a 4x ROAS (Return on Ad Spend) while feed sat at 3x. The obvious move is to launch a stories-only campaign and watch your account print money.
Do not do this.
What you are looking at is not opportunity. It is a reporting artifact that misleads even experienced buyers. Meta already evaluated that exact reallocation, decided against it, and distributed spend the way it did for a reason. The mechanism behind that decision is called the breakdown effect, and misunderstanding it is one of the most expensive mistakes in paid media.
This post is a meta ads breakdown analysis that explains how Meta actually allocates spend across placements, demographics, and individual ads. You will learn why surface-level ROAS breakdowns lie, when to trust the platform's distribution, and the one legitimate override tool that exists for experienced buyers.
Key Takeaways
Surface-level ROAS by placement, age, gender, or region does not reflect incremental value. Meta already optimized that distribution.
Meta optimizes for revenue per user per minute across multi-touch chains, not last-click ad-level ROAS.
Two ads with vastly different reported ROAS can receive equal spend because the lower-base ad still returns incrementally on the next dollar.
Do not restructure campaigns based on breakdown data unless you have 6-7 years of buying experience and a specific hypothesis to test.
Value rules (demographic bid adjustments) are the one legitimate override tool, but expect a 2-4 week lag before you can judge results.
1. What Meta Actually Optimizes (It Is Not Your ROAS Column)
The ROAS column in Ads Manager shows last-click, ad-level attribution. That is not what Meta's delivery system uses to decide where your next dollar goes.
Meta optimizes for revenue per user per minute across its entire ecosystem. The algorithm evaluates multi-touch conversion chains, distributing roughly one-third credit to each touchpoint in a three-ad path. Your campaign's delivery is governed by this internal model, not the single-touch metric you see in reporting.
At the adset level, Meta targets your CPA (Cost Per Acquisition) goal because bidding and optimization are inherited from the adset, not from individual ads or placements. This means the algorithm is constantly rebalancing spend across every available impression opportunity to hit that adset-level target as efficiently as possible.
The gap between what you see and what Meta optimizes is the core reason breakdown analysis misleads. You are reading a scorecard that measures something different from what the system is actually playing for.
2. The Placement Breakdown Trap: Why Stories at 4x Does Not Mean "Scale Stories"
Here is the scenario most buyers encounter. You break down a campaign by placement and see:
Stories: 4x ROAS, 20% of spend
Feed: 3x ROAS, 80% of spend
The naive conclusion: stories return more per dollar, so shift budget there.
Here is what actually happened. Meta already tried pushing more spend into stories. As it pushed incremental dollars into stories, the quality of each additional impression declined. The 500th stories impression converts far worse than the 50th. At some point, the incremental return on the next dollar in stories dropped below the incremental return on the next dollar in feed.
Feed holds 80% of spend not because Meta is lazy. Feed holds 80% because at that allocation, the marginal return on the next dollar is roughly equal across both placements. The base-rate ROAS you see is an average of all impressions, including the cheap early ones. It does not tell you what the next dollar in that placement will return.
When you force spend into stories by launching a stories-only campaign, you are buying those low-quality incremental impressions at scale. Your blended ROAS drops, and you end up worse than where you started.
3. Meta Ads Breakdown Analysis Beyond Placement: Age, Gender, Region, and Individual Ads
The placement example is the most common, but the same mechanism governs every breakdown in Ads Manager.
Age breakdowns: You see the 25-34 segment at a 5x ROAS and the 45-54 segment at a 2x ROAS. Meta is already pushing more impressions toward 25-34. The high ROAS reflects the average across all those impressions, but the marginal value of the next impression in that segment is lower than the marginal value of the next impression in 45-54.
Gender breakdowns: Female users show a 3.5x ROAS while male users show a 2x. The same logic applies. Meta already shifted distribution. The remaining male impressions still return incrementally even though the average looks worse.
Regional breakdowns: One DMA (Designated Market Area) looks twice as efficient as another. The efficient DMA already received more spend. The less-efficient DMA is still the better place for the next incremental dollar.
Individual ads: Two ads with very different surface-level returns can receive equal spend. The higher-base ad may return zero incrementally on its next dollar because Meta already saturated its audience. The lower-base ad still returns something on each additional dollar. Equal spend is the correct allocation in that scenario.
The pattern is always the same. What you see in breakdowns is an average. What matters for allocation decisions is the marginal return on the next dollar. Meta is already optimizing for that.
4. Why Broad Targeting Works (And Why Breakdowns Tempt You to Narrow)
Meta operates in a 10,000-dimension vector space where users cluster naturally along behavioral, interest, and contextual axes. Broad targeting lets the algorithm sprinkle impressions across this entire space, finding conversion hotspots that no manual breakdown analysis would reveal.
When you look at breakdowns and start excluding segments, you are removing parts of this vector space that the algorithm was already managing. You might cut a demographic that looks weak in isolation but contributes to multi-touch paths that convert users in other segments.
CPMs (Cost Per Thousand Impressions) inflate roughly 20-30% year over year, which forces Meta to continuously raise the expected conversion rates its algorithm demands before serving an impression. The system is already getting more selective about which impressions to buy. Adding manual constraints on top of an already-optimizing algorithm rarely improves outcomes. It usually degrades them.
If you are reviewing Meta Ads performance benchmarks by industry and your numbers look misaligned, the fix is almost never to narrow targeting based on breakdown data. The fix is usually creative, landing page quality, or offer structure.
5. The Rule: Trust the Platform's Spend Distribution
Here is the operating principle.
Do not implement changes based on complex breakdown analysis unless you are a buyer with six or seven years of experience and a specific, testable hypothesis.
For 95% of accounts, the correct response to breakdown data is: note it, understand what Meta is telling you about audience composition, and move on. Do not restructure campaigns around it. Do not launch placement-specific campaigns. Do not exclude demographics that look weak.
The metrics that actually matter for optimization decisions sit at the campaign and adset level: CPA, MER (Marketing Efficiency Ratio, calculated as total revenue divided by total marketing spend), blended ROAS, and creative-level engagement signals. These tell you whether the system is working. Breakdowns tell you how the system distributed its work, which is a description, not a prescription.
If your account-level metrics are off, the levers to pull are creative volume, landing page conversion rate, and audience signal quality. Not placement splits.
Looking for Meta ads support?
We're a small, hardworking, US-based team. Book a call and get a free audit today.
6. The One Legitimate Override: Value Rules (And Why Patience Is Required)
Value rules, also called demographic bid adjustments, are the one tool that lets you deliberately override Meta's default allocation. They allow you to bid up or down on specific demographics to shift delivery toward or away from certain segments.
Here is a real practitioner example of what happens when you use them.
A buyer identified that the 45+ age segment was converting at a CPA roughly 40% above target. They applied a value rule bidding down the 45+ segment by 50%. The delivery shift was immediate. Within the first week, impression distribution skewed noticeably younger.
But purchases lagged by 2-3 weeks.
At weeks 3-4, CPA in the adjusted account still sat roughly 25% above target. The outcome at that point was unresolved. The delivery shift happened fast, but the conversion data needed multiple purchase cycles to reflect the change.
This teaches three things:
Delivery shifts happen within days. You will see impression distribution change quickly after applying a value rule.
Conversion data lags by 2-4 weeks. Do not judge the success of a value rule override based on week-one delivery metrics. Purchases, revenue, and CPA need time to catch up.
Set a 4-week minimum evaluation window. If you adjust a value rule and judge results at day 7, you are making a decision on incomplete data. Commit to the test window.
Value rules are a legitimate tool for experienced buyers with a clear hypothesis. They are not a shortcut for reacting to breakdown data.
7. What Experienced Buyers Actually Focus On
If breakdowns are not the optimization lever, what is? The answer starts with what still matters in Meta media buying.
Creative volume and velocity. The single biggest driver of Meta Ads performance is the rate at which you test new creative concepts. At $50k-$250k/month, that means roughly 100-300 new ads per month to sustain growth. Creative fatigue, not poor audience targeting, is the most common reason accounts plateau.
Landing page conversion rate. A 1% improvement in landing page conversion rate compounds across every dollar of ad spend. Test headlines, CTAs, form length, and social proof placement continuously.
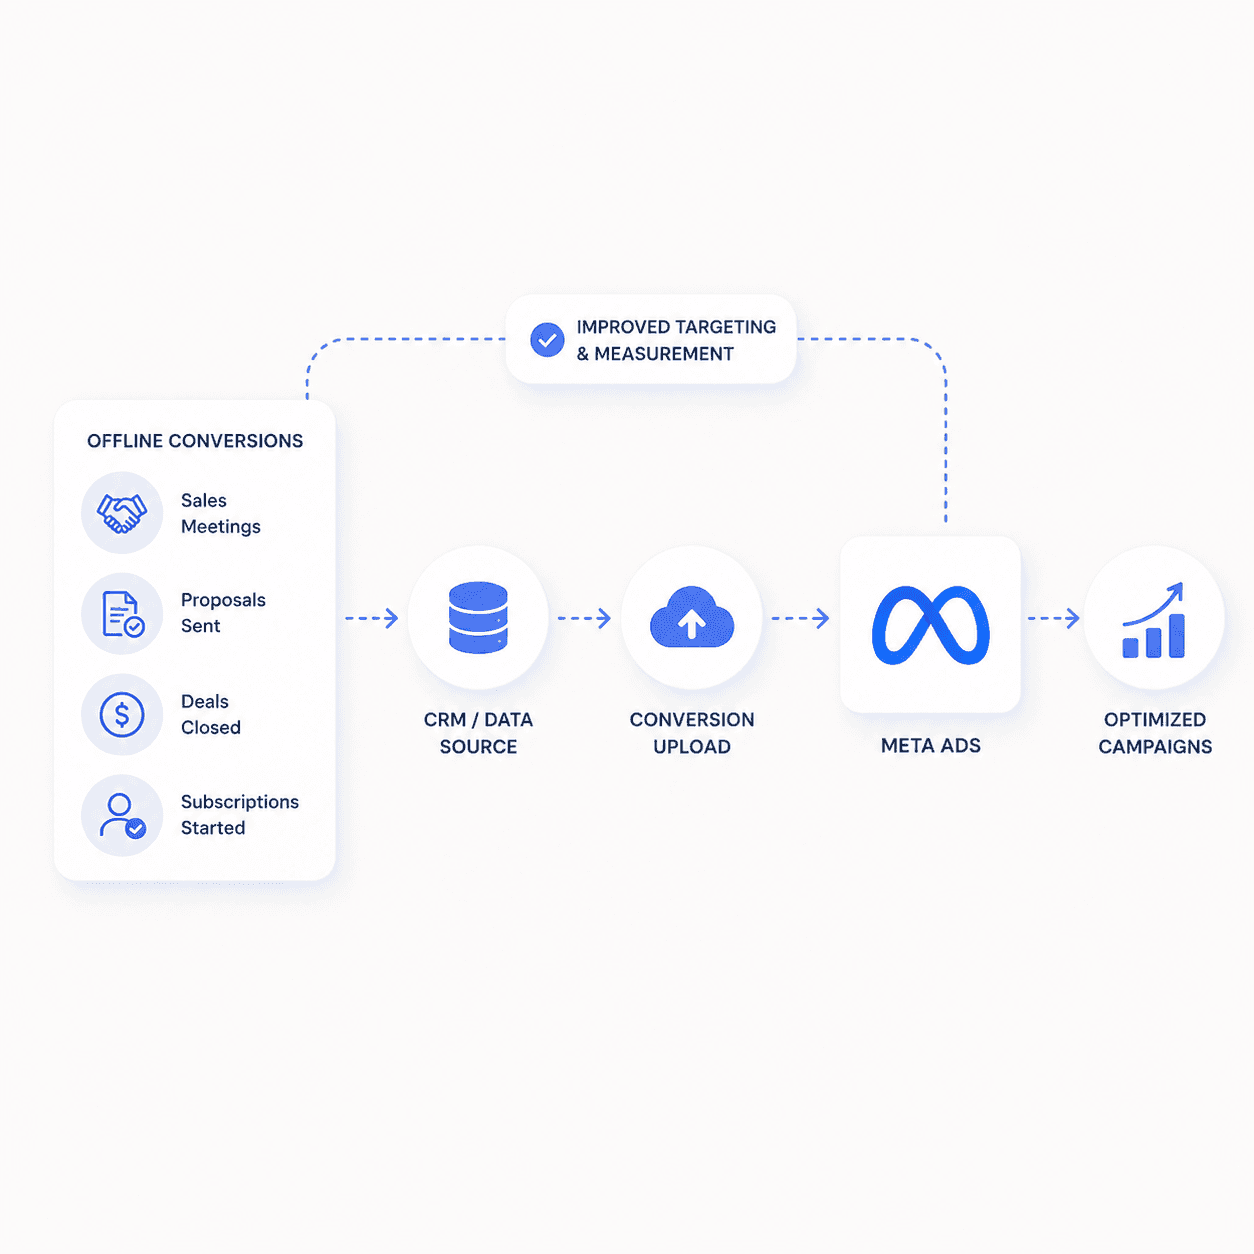
Audience signal quality. Feed Meta better data through the Conversions API, offline event uploads, and value-based optimization. Better inputs produce better algorithmic decisions, which eliminates the temptation to manually override with breakdown-driven targeting changes.
Account structure simplicity. Consolidate campaigns rather than fragmenting them based on breakdown insights. Fewer campaigns with more budget give Meta's algorithm more room to optimize. A proper account structure lets the algorithm do what it does best.
These four levers, working together, produce more incremental improvement than any breakdown-driven reallocation ever will.
Conclusion
The breakdown effect is the gap between what Ads Manager reports and what Meta's delivery system actually optimizes. Surface-level ROAS by placement, age, gender, or region reflects averages, not marginal returns. Meta already allocated spend to equalize the incremental return on the next dollar across all available inventory.
For most advertisers, the correct response to breakdown data is to observe it and move on. Focus your optimization energy on creative production, landing page performance, and signal quality. These are the levers that actually move account-level CPA and ROAS.
If you are an experienced buyer with a specific hypothesis, value rules give you a legitimate override mechanism. But commit to a 4-week evaluation window. Week-one delivery shifts do not tell the full story.
Trust the algorithm's distribution. Fix the inputs it works with.