Meta Ads Performance Benchmarks by Industry (2026 Data)
Meta Ads
May 5, 2026
Table Of Contents
No headings found on page
Meta Ads Performance Benchmarks by Industry (2026 Data)
Your Meta Ads CPA jumped 40% last month. Is that a problem, or is everyone else seeing the same thing? Without benchmarks, you're guessing.
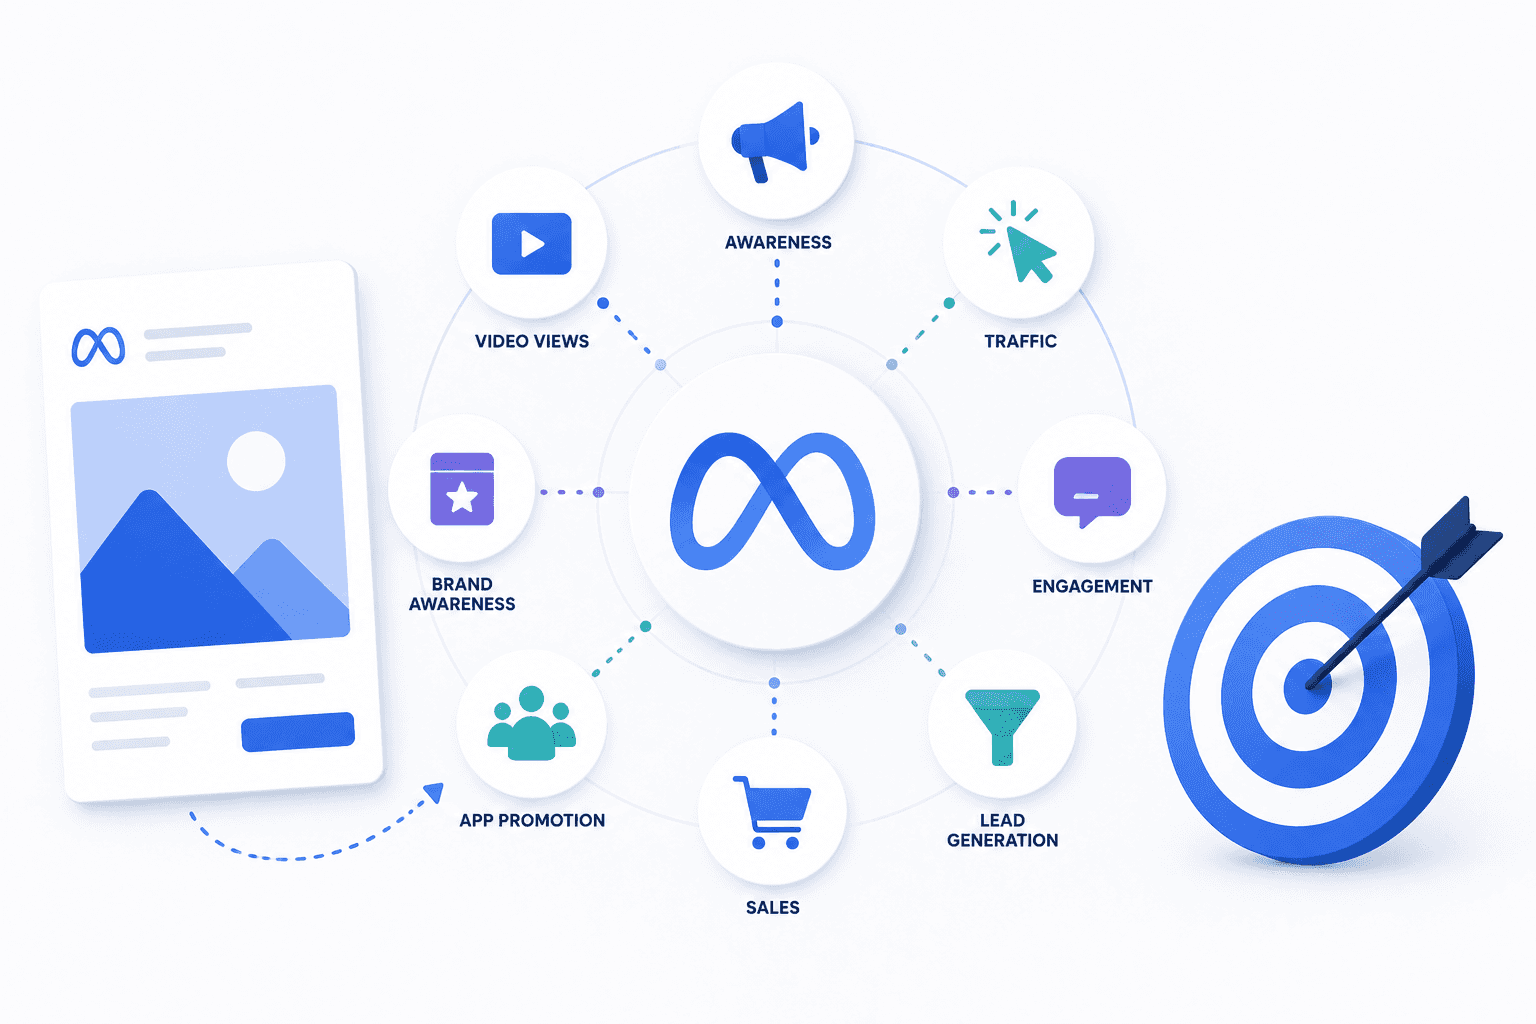
This guide covers 2026 median metrics across industries—CTR, CPC, CVR, CPA, ROAS. It also covers how placement and campaign objective shift those numbers, and what's driving benchmark changes this year.
Key Takeaways
Median CTR sits at 2.19%: Strong creative and targeting alignment drives this figure, though your industry will shift it significantly.
CPC ranges from $0.70 to $1.38: Finance and B2B sit at the high end, while e-commerce and entertainment trend lower.
Average CVR hovers around 1.57%: Conversion rate depends heavily on landing page quality and offer strength, not just ad performance.
Median CPA is $38.17: This varies dramatically by what counts as a conversion—purchases, leads, and add-to-carts all produce different CPAs.
ROAS median is 1.93x: Profitability depends entirely on your margins, not the benchmark itself.
Creative quality drives 70-80% of performance: Benchmarks assume average creative. Better creative moves you above benchmark.
Overall Facebook and Meta Ads Benchmarks
Reviewing meta ads benchmarks by placement and objective helps you interpret these numbers accurately.
Meta Ads benchmarks in 2026 paint a competitive picture. The median CTR (click-through rate, or the percentage of people who click after seeing your ad) lands at 2.19%. Median CPA (cost per acquisition, meaning what you pay for each conversion) sits at $38.17.
Median ROAS (return on ad spend, or revenue generated per dollar spent) comes in at 1.93x.
On the cost side, CPC (cost per click) varies by campaign objective. Leads campaigns average $1.92 per click, while Traffic campaigns run closer to $0.70. CVR (conversion rate, the percentage of clicks that turn into conversions) falls between 1.57% and 2.2% across industries.
E-commerce remains especially competitive, with CPCs typically between $0.50 and $0.68.
These figures represent medians across all industries and objectives. Your actual performance will vary based on vertical, price point, creative quality, and landing page experience.
Metric
Median Benchmark
What It Measures
CPM
$13.48
Cost per 1,000 impressions
CPC
$0.70–$1.38
Cost per click
CTR
2.19%
Click-through rate
CVR
1.57%–2.2%
Conversion rate
CPA
$38.17
Cost per acquisition
ROAS
1.93x
Return on ad spend
Facebook Advertising Benchmarks by Industry
Industry is the single largest variable affecting your meta ads benchmarks. A "good" CPC in finance would be catastrophic in apparel. So before comparing your metrics to any benchmark, confirm you're looking at your specific vertical.
Apparel and Fashion
Apparel typically sees lower CPCs in the $0.34–$0.50 range, but creative fatigue hits hard and fast. Seasonality drives significant swings too—Q4 CPMs can double compared to Q1. ROAS expectations often land between 2.5x and 4x depending on average order value.
Health and Wellness
Health and wellness often outperforms on conversion rate, with some sub-categories hitting 14%+ CVR. Compliance restrictions limit targeting options, which can actually reduce competition. Subscription models change the math significantly since higher lifetime value justifies higher acquisition costs.
Beauty and Cosmetics
Visual-heavy creative performs well in beauty, and influencer content typically outperforms brand-produced assets. CPMs trend higher due to competition, but strong creative can push CTR above 3%.
Food and Beverage
Impulse purchase dynamics favor aggressive retargeting in food and beverage. Local businesses see different benchmarks than DTC brands. Subscription models like meal kits and coffee subscriptions tolerate higher CPAs because of recurring revenue.
Home and Garden
Higher AOVs (average order values) of $150+ mean higher acceptable CPAs. Consideration cycles run longer in home and garden, so attribution windows matter more. Seasonal peaks around spring and holiday drive CPM spikes.
Consumer Electronics
Expect higher CPCs of $1.20+ due to competition from major brands. The research-heavy buyer journey makes retargeting essential. ROAS expectations often sit lower at 1.5x–2x because margins are thinner.
B2B and SaaS
Lead generation focus means CPA benchmarks measure cost-per-lead, not cost-per-purchase. CPAs of $50–$150 are common for qualified leads. Higher lifetime value justifies these costs, but you're measuring pipeline contribution, not immediate revenue.
Average CTR for Facebook Ads by Industry
CTR measures the percentage of impressions that result in clicks. High CTR indicates your creative and targeting are aligned—people see the ad and want to learn more. Low CTR suggests creative fatigue, audience mismatch, or weak hooks.
That said, CTR alone tells you nothing about profitability. A 5% CTR with zero conversions is worse than a 1% CTR with strong conversion rates. CTR is a leading indicator of creative health, not a measure of business outcomes.
Industry
CTR Range
Fitness
1.8%–2.5%
E-commerce
1.5%–2.2%
Finance
0.8%–1.2%
B2B
0.7%–1.1%
Beauty
1.9%–2.8%
Meta Ads Performance Benchmarks by Industry (2026 Data)
Your Meta Ads CPA jumped 40% last month. Is that a problem, or is everyone else seeing the same thing? Without benchmarks, you're guessing.
This guide covers 2026 median metrics across industries—CTR, CPC, CVR, CPA, ROAS. It also covers how placement and campaign objective shift those numbers, and what's driving benchmark changes this year.
Key Takeaways
Median CTR sits at 2.19%: Strong creative and targeting alignment drives this figure, though your industry will shift it significantly.
CPC ranges from $0.70 to $1.38: Finance and B2B sit at the high end, while e-commerce and entertainment trend lower.
Average CVR hovers around 1.57%: Conversion rate depends heavily on landing page quality and offer strength, not just ad performance.
Median CPA is $38.17: This varies dramatically by what counts as a conversion—purchases, leads, and add-to-carts all produce different CPAs.
ROAS median is 1.93x: Profitability depends entirely on your margins, not the benchmark itself.
Creative quality drives 70-80% of performance: Benchmarks assume average creative. Better creative moves you above benchmark.
Overall Facebook and Meta Ads Benchmarks
Reviewing meta ads benchmarks by placement and objective helps you interpret these numbers accurately.
Meta Ads benchmarks in 2026 paint a competitive picture. The median CTR (click-through rate, or the percentage of people who click after seeing your ad) lands at 2.19%. Median CPA (cost per acquisition, meaning what you pay for each conversion) sits at $38.17.
Median ROAS (return on ad spend, or revenue generated per dollar spent) comes in at 1.93x.
On the cost side, CPC (cost per click) varies by campaign objective. Leads campaigns average $1.92 per click, while Traffic campaigns run closer to $0.70. CVR (conversion rate, the percentage of clicks that turn into conversions) falls between 1.57% and 2.2% across industries.
E-commerce remains especially competitive, with CPCs typically between $0.50 and $0.68.
These figures represent medians across all industries and objectives. Your actual performance will vary based on vertical, price point, creative quality, and landing page experience.
Metric
Median Benchmark
What It Measures
CPM
$13.48
Cost per 1,000 impressions
CPC
$0.70–$1.38
Cost per click
CTR
2.19%
Click-through rate
CVR
1.57%–2.2%
Conversion rate
CPA
$38.17
Cost per acquisition
ROAS
1.93x
Return on ad spend
Facebook Advertising Benchmarks by Industry
Industry is the single largest variable affecting your meta ads benchmarks. A "good" CPC in finance would be catastrophic in apparel. So before comparing your metrics to any benchmark, confirm you're looking at your specific vertical.
Apparel and Fashion
Apparel typically sees lower CPCs in the $0.34–$0.50 range, but creative fatigue hits hard and fast. Seasonality drives significant swings too—Q4 CPMs can double compared to Q1. ROAS expectations often land between 2.5x and 4x depending on average order value.
Health and Wellness
Health and wellness often outperforms on conversion rate, with some sub-categories hitting 14%+ CVR. Compliance restrictions limit targeting options, which can actually reduce competition. Subscription models change the math significantly since higher lifetime value justifies higher acquisition costs.
Beauty and Cosmetics
Visual-heavy creative performs well in beauty, and influencer content typically outperforms brand-produced assets. CPMs trend higher due to competition, but strong creative can push CTR above 3%.
Food and Beverage
Impulse purchase dynamics favor aggressive retargeting in food and beverage. Local businesses see different benchmarks than DTC brands. Subscription models like meal kits and coffee subscriptions tolerate higher CPAs because of recurring revenue.
Home and Garden
Higher AOVs (average order values) of $150+ mean higher acceptable CPAs. Consideration cycles run longer in home and garden, so attribution windows matter more. Seasonal peaks around spring and holiday drive CPM spikes.
Consumer Electronics
Expect higher CPCs of $1.20+ due to competition from major brands. The research-heavy buyer journey makes retargeting essential. ROAS expectations often sit lower at 1.5x–2x because margins are thinner.
B2B and SaaS
Lead generation focus means CPA benchmarks measure cost-per-lead, not cost-per-purchase. CPAs of $50–$150 are common for qualified leads. Higher lifetime value justifies these costs, but you're measuring pipeline contribution, not immediate revenue.
Average CTR for Facebook Ads by Industry
CTR measures the percentage of impressions that result in clicks. High CTR indicates your creative and targeting are aligned—people see the ad and want to learn more. Low CTR suggests creative fatigue, audience mismatch, or weak hooks.
That said, CTR alone tells you nothing about profitability. A 5% CTR with zero conversions is worse than a 1% CTR with strong conversion rates. CTR is a leading indicator of creative health, not a measure of business outcomes.
Industry
CTR Range
Fitness
1.8%–2.5%
E-commerce
1.5%–2.2%
Finance
0.8%–1.2%
B2B
0.7%–1.1%
Beauty
1.9%–2.8%
Looking for Meta ads support?
We're a small, hardworking US-based team. Book a call and get a free audit today.
CPC reflects auction competition and audience demand. When more advertisers target the same audience, CPC rises. Finance, legal, and B2B consistently show the highest CPCs because customer lifetime value justifies aggressive bidding.
Here's the thing though: low CPC is meaningless without conversion context. A $0.30 CPC that converts at 0.5% produces a $60 CPA.
Meanwhile, a $1.50 CPC that converts at 5% produces a $30 CPA. The cheaper click costs more in the end.
Industry
CPC Range
Finance & Insurance
$1.22–$3.77
B2B
$1.27–$1.50
E-commerce
$0.34–$0.68
Healthcare
$1.27–$1.32
Entertainment
$0.40–$0.65
Average Conversion Rate for Meta Ads by Industry
CVR measures the percentage of clicks that result in a desired action—purchase, lead submission, or add-to-cart. This metric is heavily influenced by landing page quality, offer strength, and checkout experience. Your ad can perform perfectly and still produce low CVR if the landing page fails.
This is where paid media expertise, creative strategy, and landing page optimization work together. Improving any one element in isolation rarely moves CVR as much as improving all three in coordination.
Industry
CVR Range
Fitness
12%–14.29%
Education
11%–13.58%
Finance
4.87%–9.09%
E-commerce
1.5%–3%
B2B
2%–4%
Average CPA for Facebook Advertising by Industry
CPA is calculated from CPM, CTR, and CVR combined. It represents the total cost to acquire one conversion. CPA benchmarks vary dramatically based on what counts as an "acquisition"—a purchase, a lead, or an add-to-cart all produce different numbers.
CPA alone doesn't indicate efficiency either. Consider two scenarios:
$100 CPA on a $500 AOV product with 50% margins: Highly profitable.
$20 CPA on a $30 AOV product with 20% margins: Loses money on every sale.
Industry
CPA Range
E-commerce
$25–$45
B2B/SaaS
$50–$150
Finance
$40–$80
Health & Wellness
$30–$50
Education
$35–$60
Average ROAS for Meta Ads by Industry
ROAS measures revenue generated per dollar spent on ads. A 2x ROAS means $2 in revenue for every $1 in ad spend—though marketing efficiency ratio (MER) often gives a more complete picture of blended profitability. Whether ROAS alone is "good" depends entirely on your margins.
A business with 70% gross margins profits at 1.5x ROAS. A business with 30% gross margins needs 3.5x+ ROAS to break even on first purchase. Calculate your target ROAS based on your actual unit economics before comparing to any benchmark. ROAS is also a lagging indicator—by the time ROAS drops, the underlying issues like creative fatigue and audience saturation have been building for days.
Industry
ROAS Range
Apparel
2.5x–4x
Beauty
2x–3.5x
Consumer Electronics
1.5x–2.5x
Health & Wellness
2x–3x
Home & Garden
2x–3.5x
Meta Ads Benchmarks by Placement
Placement refers to where ads appear across Meta's network—Facebook Feed, Instagram Stories, Reels, Audience Network, and others. Performance varies significantly by placement, and knowing where your ads run helps explain benchmark differences.
Placement
Typical CPM
Typical CTR
Best For
Facebook Feed
$12–$18
1.8%–2.5%
Broad reach, baseline performance
Instagram Feed
$14–$20
2%–2.8%
Visual brands, higher engagement
Instagram Stories
$10–$15
1.5%–2.2%
Direct response, full-screen format
Instagram Reels
$8–$14
1.8%–2.5%
Video-native content, growing inventory
Audience Network
$4–$8
0.5%–1%
Use cautiously, monitor CVR closely
Advantage+ placements optimize automatically, though manual selection sometimes outperforms for specific objectives. Testing both approaches reveals what works for your account.
What is Driving Facebook Ads Benchmark Changes
Meta ads benchmarks shift year over year. Knowing why helps you anticipate changes rather than react to them.
AI and Advantage+ automation have changed campaign structure fundamentally. Dataslayer's analysis found Advantage+ Shopping delivers approximately 32% lower CPA than manual campaigns, but broader adoption also increases competition as more advertisers adopt similar approaches. Our guide on the best Meta Ads account structure in 2026 covers how to adapt.
Creative format shifts toward video and Reels mean static-only advertisers see declining efficiency. Reels placements receive preferential delivery—over 50% of Instagram ads ran in Reels in 2025—and video content typically outperforms static on engagement metrics. Review our Meta Ads creative strategies that work in 2026 for format-specific guidance.
Privacy changes and signal loss from iOS updates and cookie deprecation affect attribution and optimization—roughly 75% of iOS users have opted out of tracking. Benchmarks now reflect less complete data, and conversion modeling fills gaps imperfectly. Learn how to respond with our Meta Ads best practices guide.
How to Use Facebook Ad Benchmarks
Meta ads benchmarks are reference points, not targets. Here's how to apply them to your account.
1. Establish Your Current Baseline
Pull your last 30-60 days of performance data. Your own historical trends matter more than industry averages. If your CPA has been $35 and suddenly jumps to $50, that's more actionable than knowing the industry average is $38.
2. Segment by Objective and Placement
Comparing blended metrics to benchmarks is misleading. A Traffic campaign and a Conversions campaign produce completely different CPCs—segment before benchmarking. Otherwise you're comparing apples to oranges.
3. Factor in Creative Quality and Landing Page Experience
Benchmarks assume average creative and average landing pages. Improving both moves performance above benchmark. Writing a strong creative brief is the first step to producing above-average creative consistently.
This is where the interdependence of paid media expertise, creative strategy, and landing page optimization becomes visible—each element affects the others.
4. Monitor Leading Indicators Before Benchmarks Decay
Rising frequency, declining first-time impression rate, and dropping CTR signal performance decay before CPA rises. Proactive monitoring prevents reactive scrambling. By the time CPA spikes, you're already behind.
Why Facebook Benchmarks Alone Do Not Guarantee Performance
Meta ads benchmarks tell you where the average advertiser lands. They don't tell you how to outperform. Hitting benchmark CPA while your competitor beats it by 30% still means you're losing market share.
Outperforming benchmarks requires integrated execution across paid media, creative, and landing pages—not optimizing each in isolation. The brands that consistently beat benchmarks treat paid media expertise, creative strategy, and landing page optimization as interdependent, not separate workstreams.
How do Meta Ads benchmarks change when scaling spend?
As you scale spend, CPMs typically increase because you're expanding beyond your core audience segment. Maintaining efficiency at higher spend requires faster creative refresh cycles and broader audience testing.
What benchmarks should advertisers expect during creative testing versus scaling phases?
During creative testing, expect higher CPAs and lower ROAS as you identify winning angles. During scaling, benchmarks stabilize or improve as budget flows to proven performers.
How do Advantage Plus campaigns compare to manual Meta Ads campaigns?
Advantage+ campaigns often deliver lower CPAs for e-commerce brands with strong creative volume. However, they reduce targeting control and can make diagnosing performance issues more difficult.
How does average order value affect which Meta Ads benchmarks matter most?
Higher AOV businesses can tolerate higher CPAs and lower ROAS while remaining profitable. Benchmark evaluation always accounts for your unit economics rather than generic industry ranges.
What leading indicators predict Meta Ads benchmark decline before CPA rises?
Rising frequency, declining first-time impression rate, and dropping CTR on existing creatives are early warning signs that performance decay is coming before CPA increases.