Blended ROAS vs Platform ROAS: Understanding the Difference
Paid Media
April 21, 2026
Table Of Contents
No headings found on page
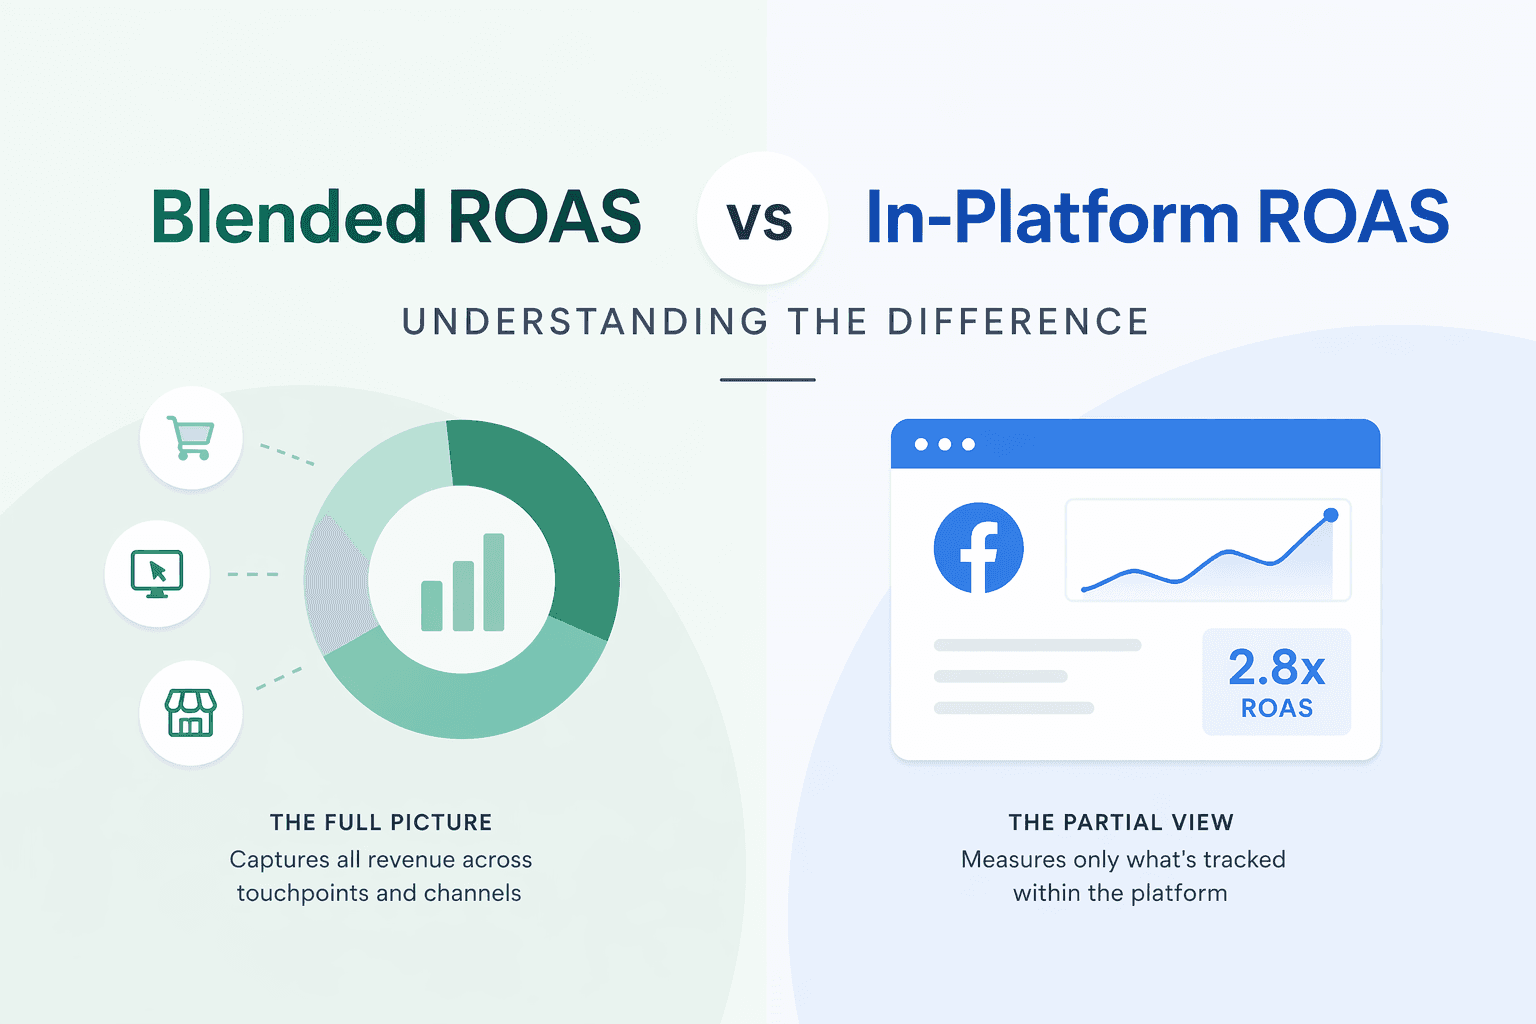
Platform ROAS tells you what Meta, Google, or TikTok wants you to believe about your ad performance. Blended ROAS tells you what's actually happening to your business.
The difference matters more than most brands realize. When platforms claim overlapping credit for the same conversions, your reported ROAS can look healthy while your margins quietly erode. This guide breaks down how each metric works, when to use which, and how to spot the gap between what platforms report and what your backend revenue confirms.
Key Takeaways
Platform ROAS is the return on ad spend reported by a single advertising platform (Meta, Google, TikTok) using its own attribution model. It helps you compare ad performance within that platform, though it often overstates actual efficiency.
Blended ROAS divides your total revenue by your total ad spend across all paid channels. It gives you a holistic view of marketing efficiency without the double-counting that happens when multiple platforms claim the same conversions.
The gap between the two metrics matters. If Meta reports a 4x ROAS but your blended ROAS is 1.8x, the platform is likely over-attributing conversions—or other costs are eating into your margins.
Use platform ROAS for tactical optimization like creative testing and audience comparisons. Use blended ROAS for strategic decisions like scaling spend, setting budgets, and evaluating profitability.
Blended ROAS tells you if your business is actually making money from paid acquisition. Platform ROAS tells you what the platform wants you to believe.
What Is Platform ROAS
Platform ROAS is the return on ad spend that an advertising platform reports based on its own attribution model. When Meta says you earned $4 for every $1 spent, that number is platform ROAS.
The formula looks like this:
Platform ROAS = Revenue Attributed by Platform ÷ Ad Spend on That Platform
Each platform uses its own attribution window to determine which conversions it claims credit for. Meta defaults to a 7-day click and 1-day view attribution window. Google has different settings. TikTok has another approach entirely. None of them are standardized.
Here's the thing: platform ROAS only measures conversions the platform believes it influenced. It doesn't know about the email your customer opened before purchasing, the Google search they ran, or the friend who recommended your product. It just knows they saw or clicked an ad within its attribution window, so it takes credit.
What Is Blended ROAS
Blended ROAS takes a wider view. Instead of asking "what did this one platform deliver," it asks "what did all my paid media deliver together?"
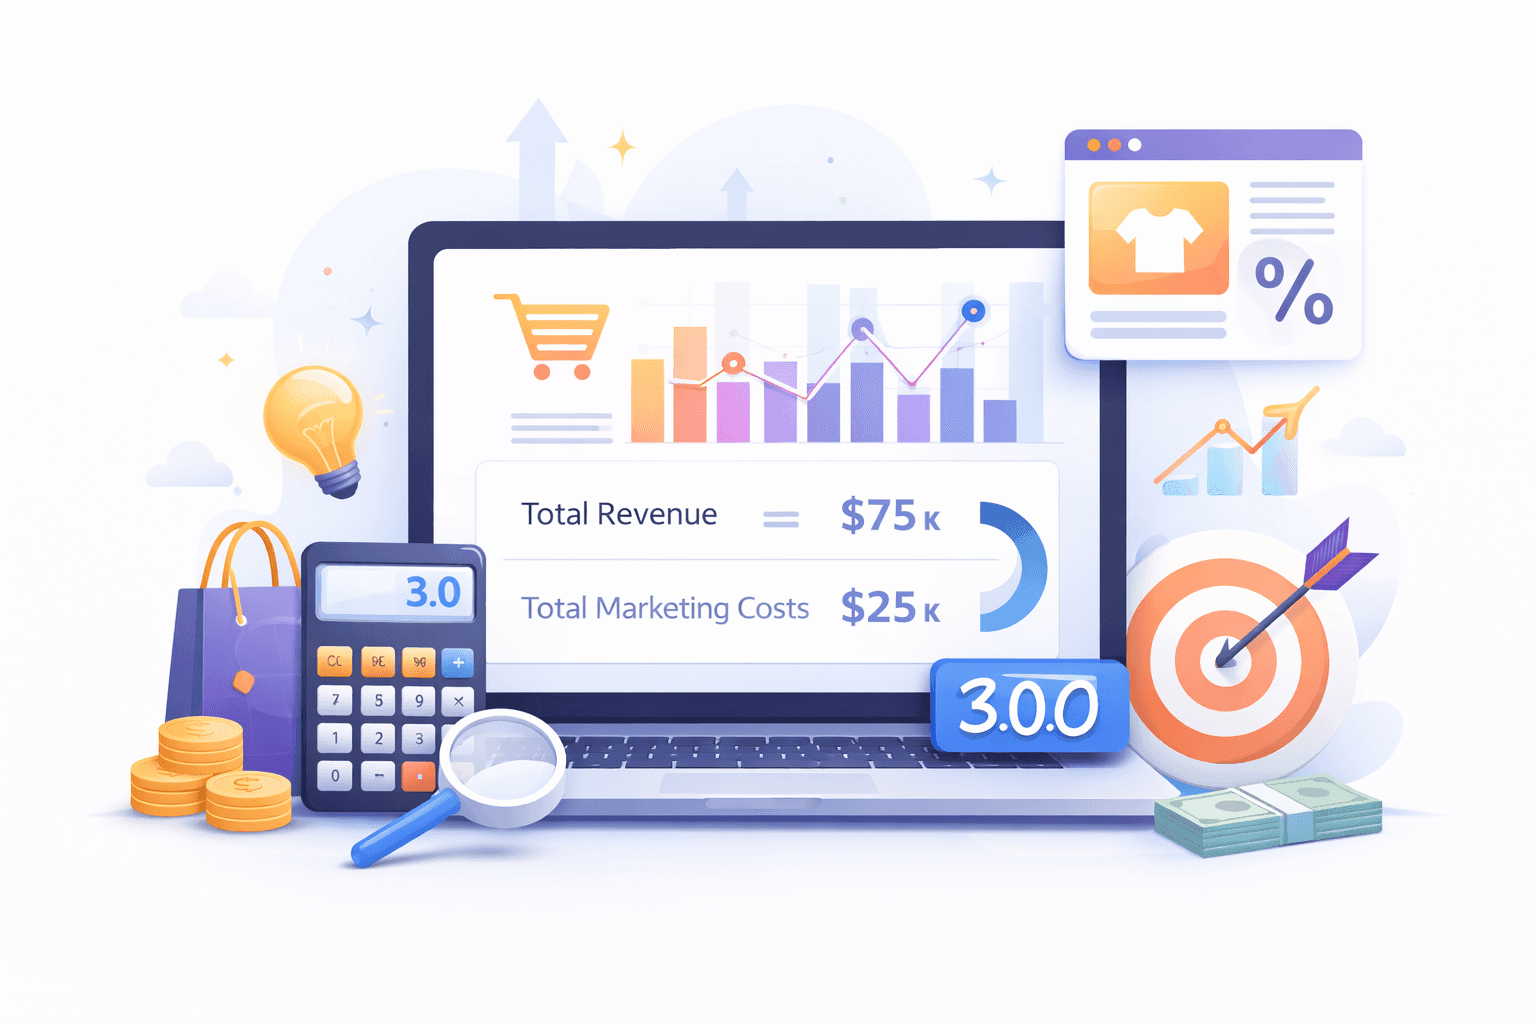
Blended ROAS = Total Revenue ÷ Total Paid Ad Spend
Total revenue comes from your backend—Shopify, your analytics platform, your ERP. Total paid ad spend is the sum of everything you spent on Meta, Google, TikTok, and any other paid channels during the same period.
You might also hear this called MER, or Marketing Efficiency Ratio. Some brands use MER to include non-paid marketing costs like influencer fees or agency retainers, but for most DTC operators, blended ROAS and MER mean the same thing.
One important note: blended ROAS doesn't isolate organic or direct traffic. Sales from organic search, email, and direct visits show up in your total revenue, which affects the numerator. That's actually a feature, not a bug—it captures the full picture of how your marketing ecosystem performs rather than giving credit to individual channels.
Why Platform ROAS and Blended ROAS Show Different Numbers
If both metrics measured the same thing, you wouldn't need both. They diverge for a few structural reasons worth understanding.
Factor
Platform ROAS
Blended ROAS
Data source
Single platform's attribution
Backend revenue + total spend
Attribution overlap
Claims shared conversions
No duplication
Organic/direct traffic
Excluded
Included in revenue
Multi-touch journeys and attribution overlap
Your customer might see a TikTok ad on Monday, click a Meta retargeting ad on Wednesday, then convert through a branded Google search on Friday. With customers averaging 6.5 touchpoints before converting, each platform claims that sale. When you add up platform-reported revenue across channels, the total often exceeds your actual revenue—sometimes by 30% or more.
Platform self-reporting bias
Platforms are incentivized to show favorable results. Their attribution models default to crediting their own touchpoints whenever possible. Meta isn't lying to you—it over-reports conversions by 26% compared to third-party analytics—but it's also not going out of its way to give credit to Google or TikTok.
Organic and direct traffic exclusion
Platform ROAS ignores revenue from organic search, email, referrals, and direct visits entirely. Blended ROAS captures total revenue, so all of your sales affect the numerator. If your brand has strong organic demand or a loyal email list, blended ROAS will look quite different than the sum of your platform metrics.
Platform ROAS tells you what Meta, Google, or TikTok wants you to believe about your ad performance. Blended ROAS tells you what's actually happening to your business.
The difference matters more than most brands realize. When platforms claim overlapping credit for the same conversions, your reported ROAS can look healthy while your margins quietly erode. This guide breaks down how each metric works, when to use which, and how to spot the gap between what platforms report and what your backend revenue confirms.
Key Takeaways
Platform ROAS is the return on ad spend reported by a single advertising platform (Meta, Google, TikTok) using its own attribution model. It helps you compare ad performance within that platform, though it often overstates actual efficiency.
Blended ROAS divides your total revenue by your total ad spend across all paid channels. It gives you a holistic view of marketing efficiency without the double-counting that happens when multiple platforms claim the same conversions.
The gap between the two metrics matters. If Meta reports a 4x ROAS but your blended ROAS is 1.8x, the platform is likely over-attributing conversions—or other costs are eating into your margins.
Use platform ROAS for tactical optimization like creative testing and audience comparisons. Use blended ROAS for strategic decisions like scaling spend, setting budgets, and evaluating profitability.
Blended ROAS tells you if your business is actually making money from paid acquisition. Platform ROAS tells you what the platform wants you to believe.
What Is Platform ROAS
Platform ROAS is the return on ad spend that an advertising platform reports based on its own attribution model. When Meta says you earned $4 for every $1 spent, that number is platform ROAS.
The formula looks like this:
Platform ROAS = Revenue Attributed by Platform ÷ Ad Spend on That Platform
Each platform uses its own attribution window to determine which conversions it claims credit for. Meta defaults to a 7-day click and 1-day view attribution window. Google has different settings. TikTok has another approach entirely. None of them are standardized.
Here's the thing: platform ROAS only measures conversions the platform believes it influenced. It doesn't know about the email your customer opened before purchasing, the Google search they ran, or the friend who recommended your product. It just knows they saw or clicked an ad within its attribution window, so it takes credit.
What Is Blended ROAS
Blended ROAS takes a wider view. Instead of asking "what did this one platform deliver," it asks "what did all my paid media deliver together?"
Blended ROAS = Total Revenue ÷ Total Paid Ad Spend
Total revenue comes from your backend—Shopify, your analytics platform, your ERP. Total paid ad spend is the sum of everything you spent on Meta, Google, TikTok, and any other paid channels during the same period.
You might also hear this called MER, or Marketing Efficiency Ratio. Some brands use MER to include non-paid marketing costs like influencer fees or agency retainers, but for most DTC operators, blended ROAS and MER mean the same thing.
One important note: blended ROAS doesn't isolate organic or direct traffic. Sales from organic search, email, and direct visits show up in your total revenue, which affects the numerator. That's actually a feature, not a bug—it captures the full picture of how your marketing ecosystem performs rather than giving credit to individual channels.
Why Platform ROAS and Blended ROAS Show Different Numbers
If both metrics measured the same thing, you wouldn't need both. They diverge for a few structural reasons worth understanding.
Factor
Platform ROAS
Blended ROAS
Data source
Single platform's attribution
Backend revenue + total spend
Attribution overlap
Claims shared conversions
No duplication
Organic/direct traffic
Excluded
Included in revenue
Multi-touch journeys and attribution overlap
Your customer might see a TikTok ad on Monday, click a Meta retargeting ad on Wednesday, then convert through a branded Google search on Friday. With customers averaging 6.5 touchpoints before converting, each platform claims that sale. When you add up platform-reported revenue across channels, the total often exceeds your actual revenue—sometimes by 30% or more.
Platform self-reporting bias
Platforms are incentivized to show favorable results. Their attribution models default to crediting their own touchpoints whenever possible. Meta isn't lying to you—it over-reports conversions by 26% compared to third-party analytics—but it's also not going out of its way to give credit to Google or TikTok.
Organic and direct traffic exclusion
Platform ROAS ignores revenue from organic search, email, referrals, and direct visits entirely. Blended ROAS captures total revenue, so all of your sales affect the numerator. If your brand has strong organic demand or a loyal email list, blended ROAS will look quite different than the sum of your platform metrics.
The math is simple. The discipline is in pulling accurate inputs from the right sources.
Blended ROAS = Total Revenue ÷ Total Paid Ad Spend
Total revenue: All revenue recorded in your backend over a given period. Use the same source you'd use for financial reporting—typically Shopify or your ERP.
Total paid ad spend: The sum of spend across Meta, Google, TikTok, and any other paid channels during that same period.
Example calculation for a DTC brand
Let's say you're running a skincare brand. Over the past 30 days, your numbers look like this:
Shopify revenue: $150,000
Meta spend: $25,000
Google spend: $10,000
TikTok spend: $5,000
Total ad spend = $40,000
Blended ROAS = $150,000 ÷ $40,000 = 3.75
Meanwhile, Meta might report a 5x ROAS, Google might show 6x (thanks to branded search capturing existing demand), and TikTok might show 2x. None of those numbers are wrong—they're just incomplete. They each tell part of the story, but blended ROAS tells you the whole thing.
When to Use Platform ROAS vs Blended ROAS
Both metrics have a place in your reporting. The key is knowing which one to trust for which decision.
When platform ROAS is useful
Creative testing: Compare ad-level performance within the same platform. If Ad A shows 3x ROAS and Ad B shows 1.5x, Ad A is likely outperforming—even if the absolute numbers are inflated.
Audience modeling: Evaluate which audiences respond to specific campaigns. Relative performance within a platform is still meaningful for optimization.
Tactical optimization: Adjust bids, placements, or ad sets based on relative performance. Platform ROAS helps you optimize inside the channel.
When blended ROAS guides decisions
Scaling spend: Determine if increased investment is yielding incremental revenue. If you doubled spend and blended ROAS dropped from 4x to 2.5x, you're hitting diminishing returns.
Budget allocation: Decide how to distribute spend across channels. Blended ROAS shows whether your overall mix is working.
Profitability analysis: Assess whether your marketing is sustainable at current spend levels. This is the number your CFO cares about.
Blended ROAS Benchmarks for Ecommerce Brands
Benchmarks vary by average order value, margin, and customer acquisition goals, with average ecommerce ROAS at 2.87x and declining amid rising CPMs. A brand with 70% gross margins can tolerate a lower blended ROAS than one with 40% margins.
Meta Ads blended ROAS benchmarks
For brands spending $50K–$200K per month on Meta, a healthy blended ROAS typically falls between 2.5x and 4x. Below 2x, you're likely unprofitable unless your customer lifetime value is strong. Above 5x, you might be under-spending and leaving growth on the table.
Google Ads blended ROAS benchmarks
Google often shows higher platform ROAS because branded search captures existing demand from people who already know your brand. Blended ROAS accounts for this more accurately by including all revenue sources.
TikTok and emerging channel benchmarks
Newer channels often show lower platform ROAS but contribute to upper-funnel awareness that drives conversions elsewhere. Blended ROAS captures this contribution over time, even if TikTok's in-platform numbers look weak in isolation.
How to Detect ROAS Inflation in Your Ad Account
Compare platform ROAS to backend revenue
Pull revenue from your ecommerce backend and compare it to the sum of platform-reported revenue. If platforms claim $200K in attributed revenue but your backend shows $150K, you have roughly 33% inflation. That gap tells you how much the platforms are over-counting.
Monitor first-time impression rate and frequency
First-time impression rate measures the percentage of impressions reaching new users. High frequency combined with low first-time impression rate suggests your ads are re-engaging existing customers rather than finding new ones—inflating attributed conversions without driving new demand.
Run a holdout or geo lift test
Pause ads in a specific region or customer segment and measure the revenue impact. This form of incrementality testing is the gold standard for validating ROAS. If revenue barely drops when you pause ads, your platform ROAS was overstated.
Common ROAS Mistakes DTC Brands Make
1. Scaling spend based on platform ROAS alone
High platform ROAS can mask diminishing returns. Brands scale aggressively because Meta keeps showing 4x, then wonder why profitability declines even as the platform metrics stay strong.
2. Cutting channels that assist but do not convert last-click
Upper-funnel channels like TikTok or YouTube often assist conversions that get attributed to other platforms. Killing them can hurt blended ROAS even if their platform ROAS looked weak—you're removing the top of the funnel without realizing it.
3. Ignoring contribution margin in favor of ROAS
ROAS doesn't account for product margins, shipping costs, or returns. A 4x ROAS on a low-margin product may still be unprofitable. Always pair ROAS with contribution margin analysis and know your break even ROAS before scaling.
How Blended ROAS Guides Budget and Creative Decisions
Reallocating spend across channels
Use blended ROAS trends to shift budget toward channels contributing to overall efficiency. If blended ROAS improves when you increase Meta spend but drops when you increase Google spend, that's a signal worth following.
Prioritizing creative testing based on blended ROAS
Creative fatigue often shows up in declining blended ROAS before platform metrics react. A drop in blended ROAS with stable platform ROAS is an early warning to refresh creative—the platforms haven't caught up yet, but your overall efficiency is already suffering.
Connecting blended ROAS to landing page performance
A drop in blended ROAS with stable ad metrics may indicate a site experience problem rather than a media buying issue. This is where paid media, creative strategy, and landing page optimization work together. Diagnosing blended ROAS issues often requires looking across all three areas rather than focusing on ads alone.
Looking for a partner who tracks blended ROAS alongside platform metrics? Flighted optimizes across paid media, creative, and landing pages as one integrated system. Book a call to discuss your growth goals.
FAQs About Blended ROAS vs Platform ROAS
Is blended ROAS the same as Marketing Efficiency Ratio (MER)?
For most DTC brands, yes. Some operators define MER to include non-paid marketing costs like influencer fees, but the terms are often used interchangeably in practice.
How often should I recalculate blended ROAS?
Weekly at minimum. Daily if you're actively scaling or testing new creative. Longer windows smooth out noise but delay your ability to react to changes.
Does blended ROAS include revenue from organic traffic?
Yes. The numerator is total revenue regardless of source. This is why blended ROAS reflects overall marketing efficiency rather than paid media performance in isolation.
Can blended ROAS be too high?
A very high blended ROAS may indicate you're under-spending on acquisition and leaving growth on the table. If blended ROAS is far above your target ROAS, test scaling spend to see if efficiency holds.